Introduction
In the fast-paced world of software development, where user satisfaction hinges on speed and reliability, our team encountered a perplexing challenge: the initial requests to our Java applications were significantly latent, resulting in frustrating timeouts and a troubling increase in 5xx errors.
As we investigated further, we discovered that the first few requests were plagued by delays that severely impacted overall performance. This article dives into how we uncovered the root causes behind the initial request delays, unpacking the intricacies of Java application performance and the myriad factors at play. These factors include all the stages–from cold starts to resource allocation to application and infrastructure issues. We aim to shed light on how these issues manifest and, more importantly, how we can address them effectively, ensuring a seamless and efficient user experience.
Bootstrap connections
In tackling the issue of delayed initial API calls, our first instinct was to investigate the connections to various data sources, such as MySQL and OpenSearch. We suspected that the lack of pre-established connections was contributing to the increased latency for those crucial first requests. To address this, we implemented a strategy to bootstrap these connections during the service startup phase, ensuring they were ready for action as soon as the application went live.
After implementing this solution, we conducted a series of tests to gauge its effectiveness. To our satisfaction, we observed a marginal reduction in latency of about 100 milliseconds for the initial calls. While this improvement was a step in the right direction, it fell short of our expectations for a more significant boost in performance. This experience highlighted the complexity of optimizing application responsiveness and reminded us that latency issues often have multiple contributing factors.
While we were encouraged by the slight improvement, we recognized that this was just the beginning of our optimization journey, and had a long way to go.
Execute SQL queries
Even after bootstrapping MySQL connections at startup, we found ourselves puzzled by the significant time spent executing even the simplest database queries. This discrepancy challenged our initial assumption that connection establishment was the primary source of latency. Intrigued, we decided to experiment by executing a straightforward query during the application startup phase, just to see if it would have any impact.
By running a simple query, essentially a no-op, during startup, we primed the database connection and its execution context, significantly reducing the response time for the initial API calls. Encouraged by these findings, we extended this solution across all our Java applications, systematically incorporating the execution of this preliminary query into their startup routines.
The results were compelling; we saved valuable seconds, ~3-4s. The problem still persisted though. The initial calls were still latent and took ~6s.
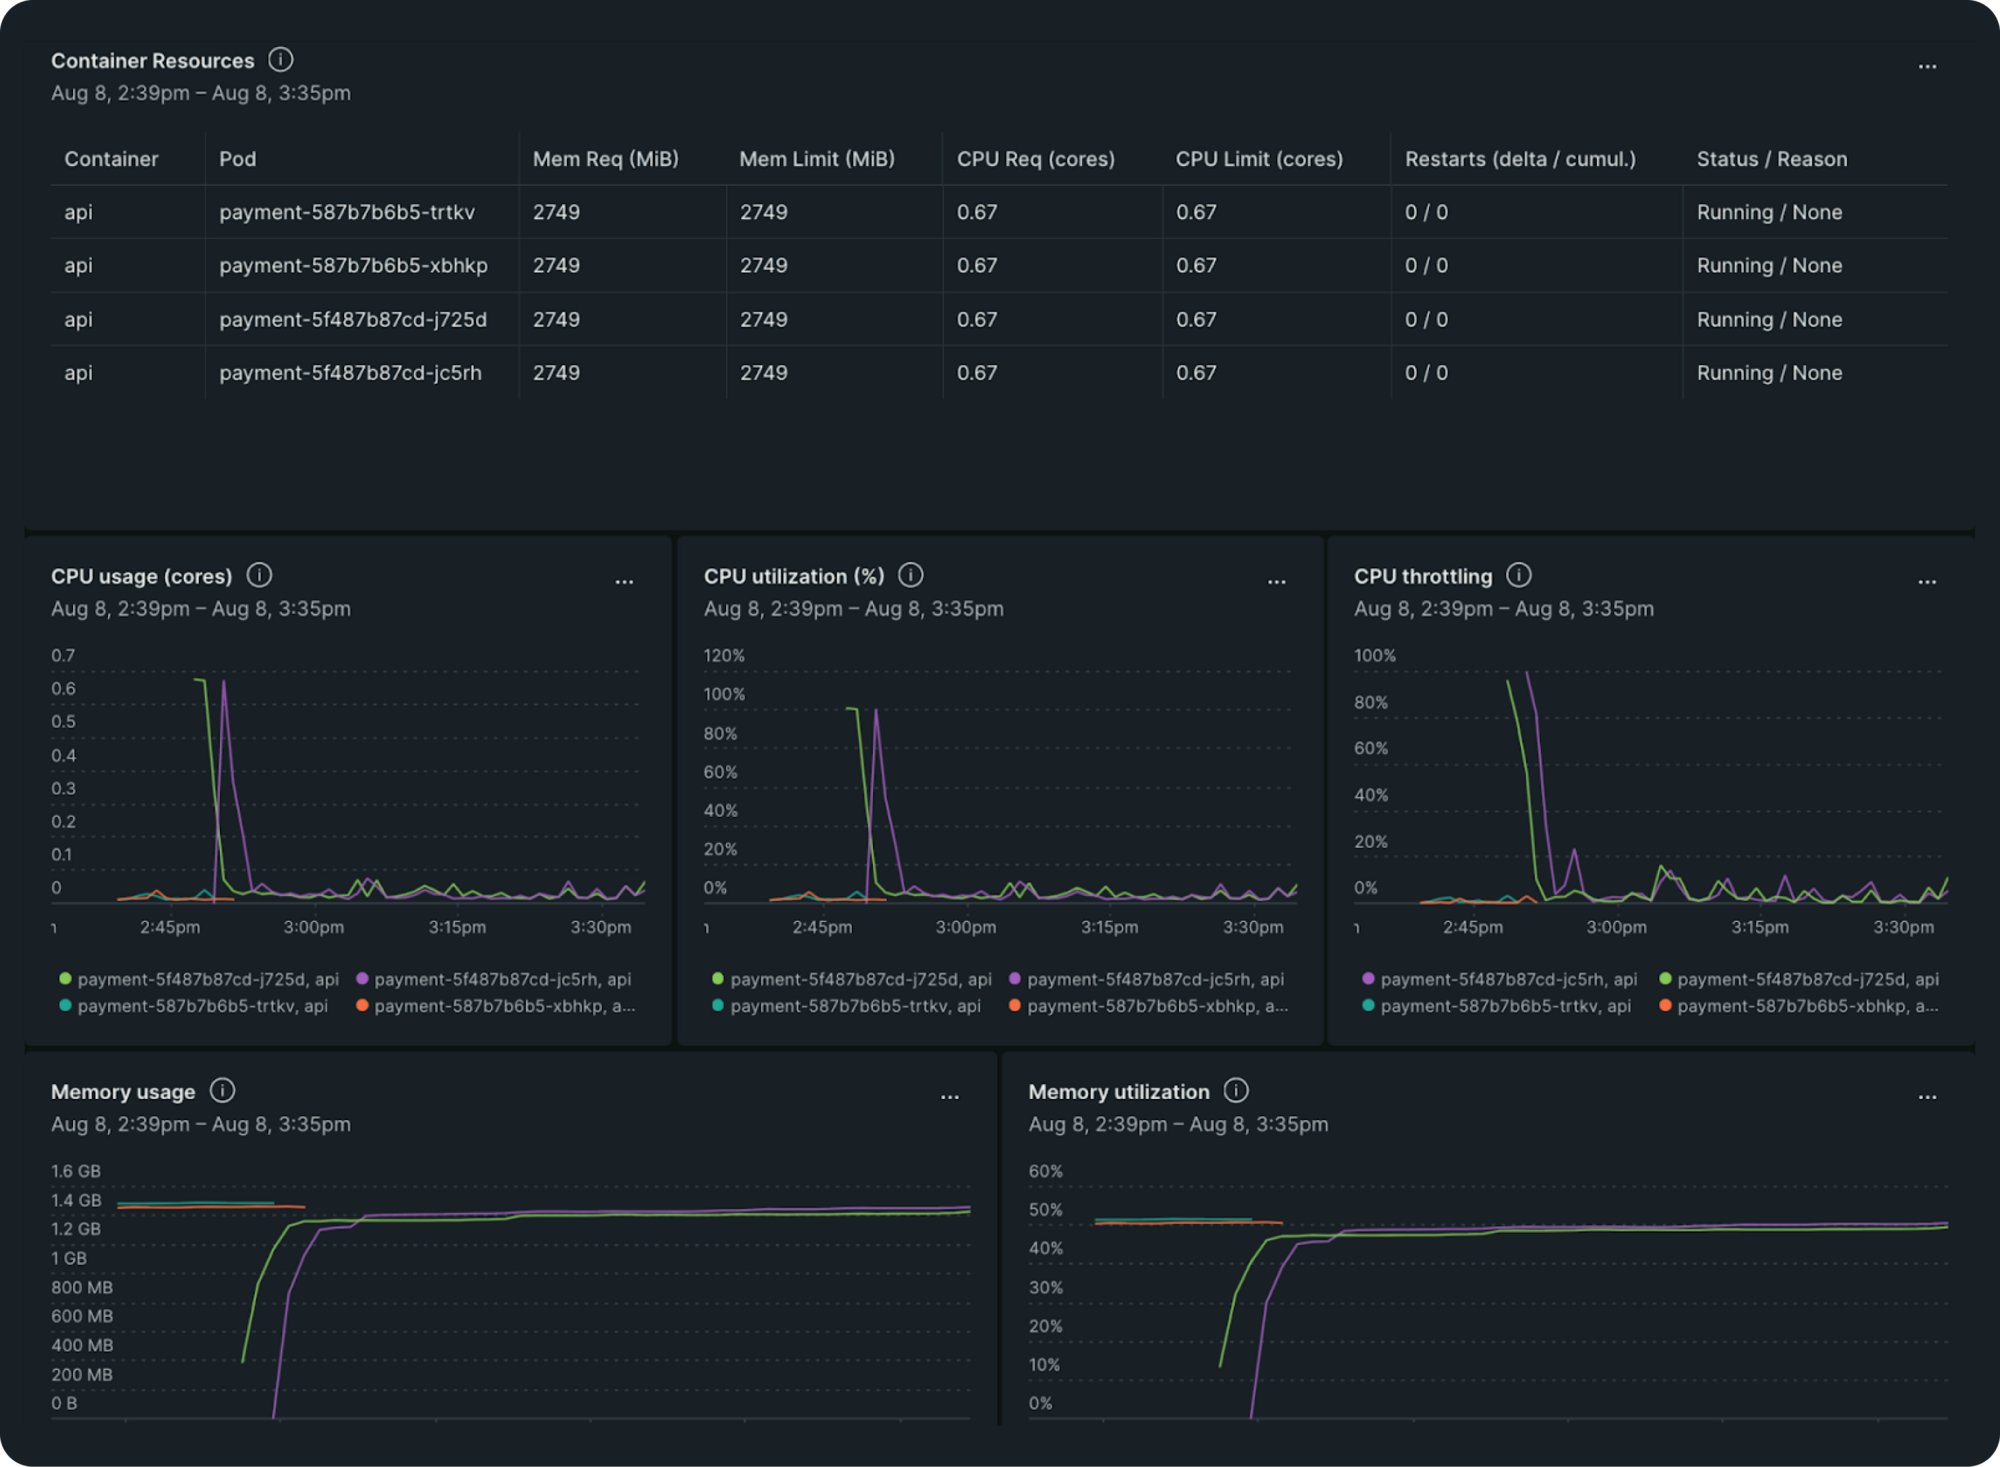
Recognizing that the obvious fixes weren’t sufficient, we shifted our focus to pod and node-level metrics. Delving into the performance data, we discovered a pattern: during deployment, as the service was starting up, and before and as the initial call was served, CPU utilization on the pods was high, and we were also experiencing throttling. This insight pointed to a critical issue with CPU allocation.
To provide some context, we use Kubernetes and were operating under a CPU request and limit of 0.896 for our pods. While this might seem reasonable, it became clear that this allocation was inadequate for our application's demands, especially during peak startup times when resources were strained. The high CPU utilization and throttling indicated that our pods were frequently hitting their limits, causing delays in processing and increasing latency for the initial requests.
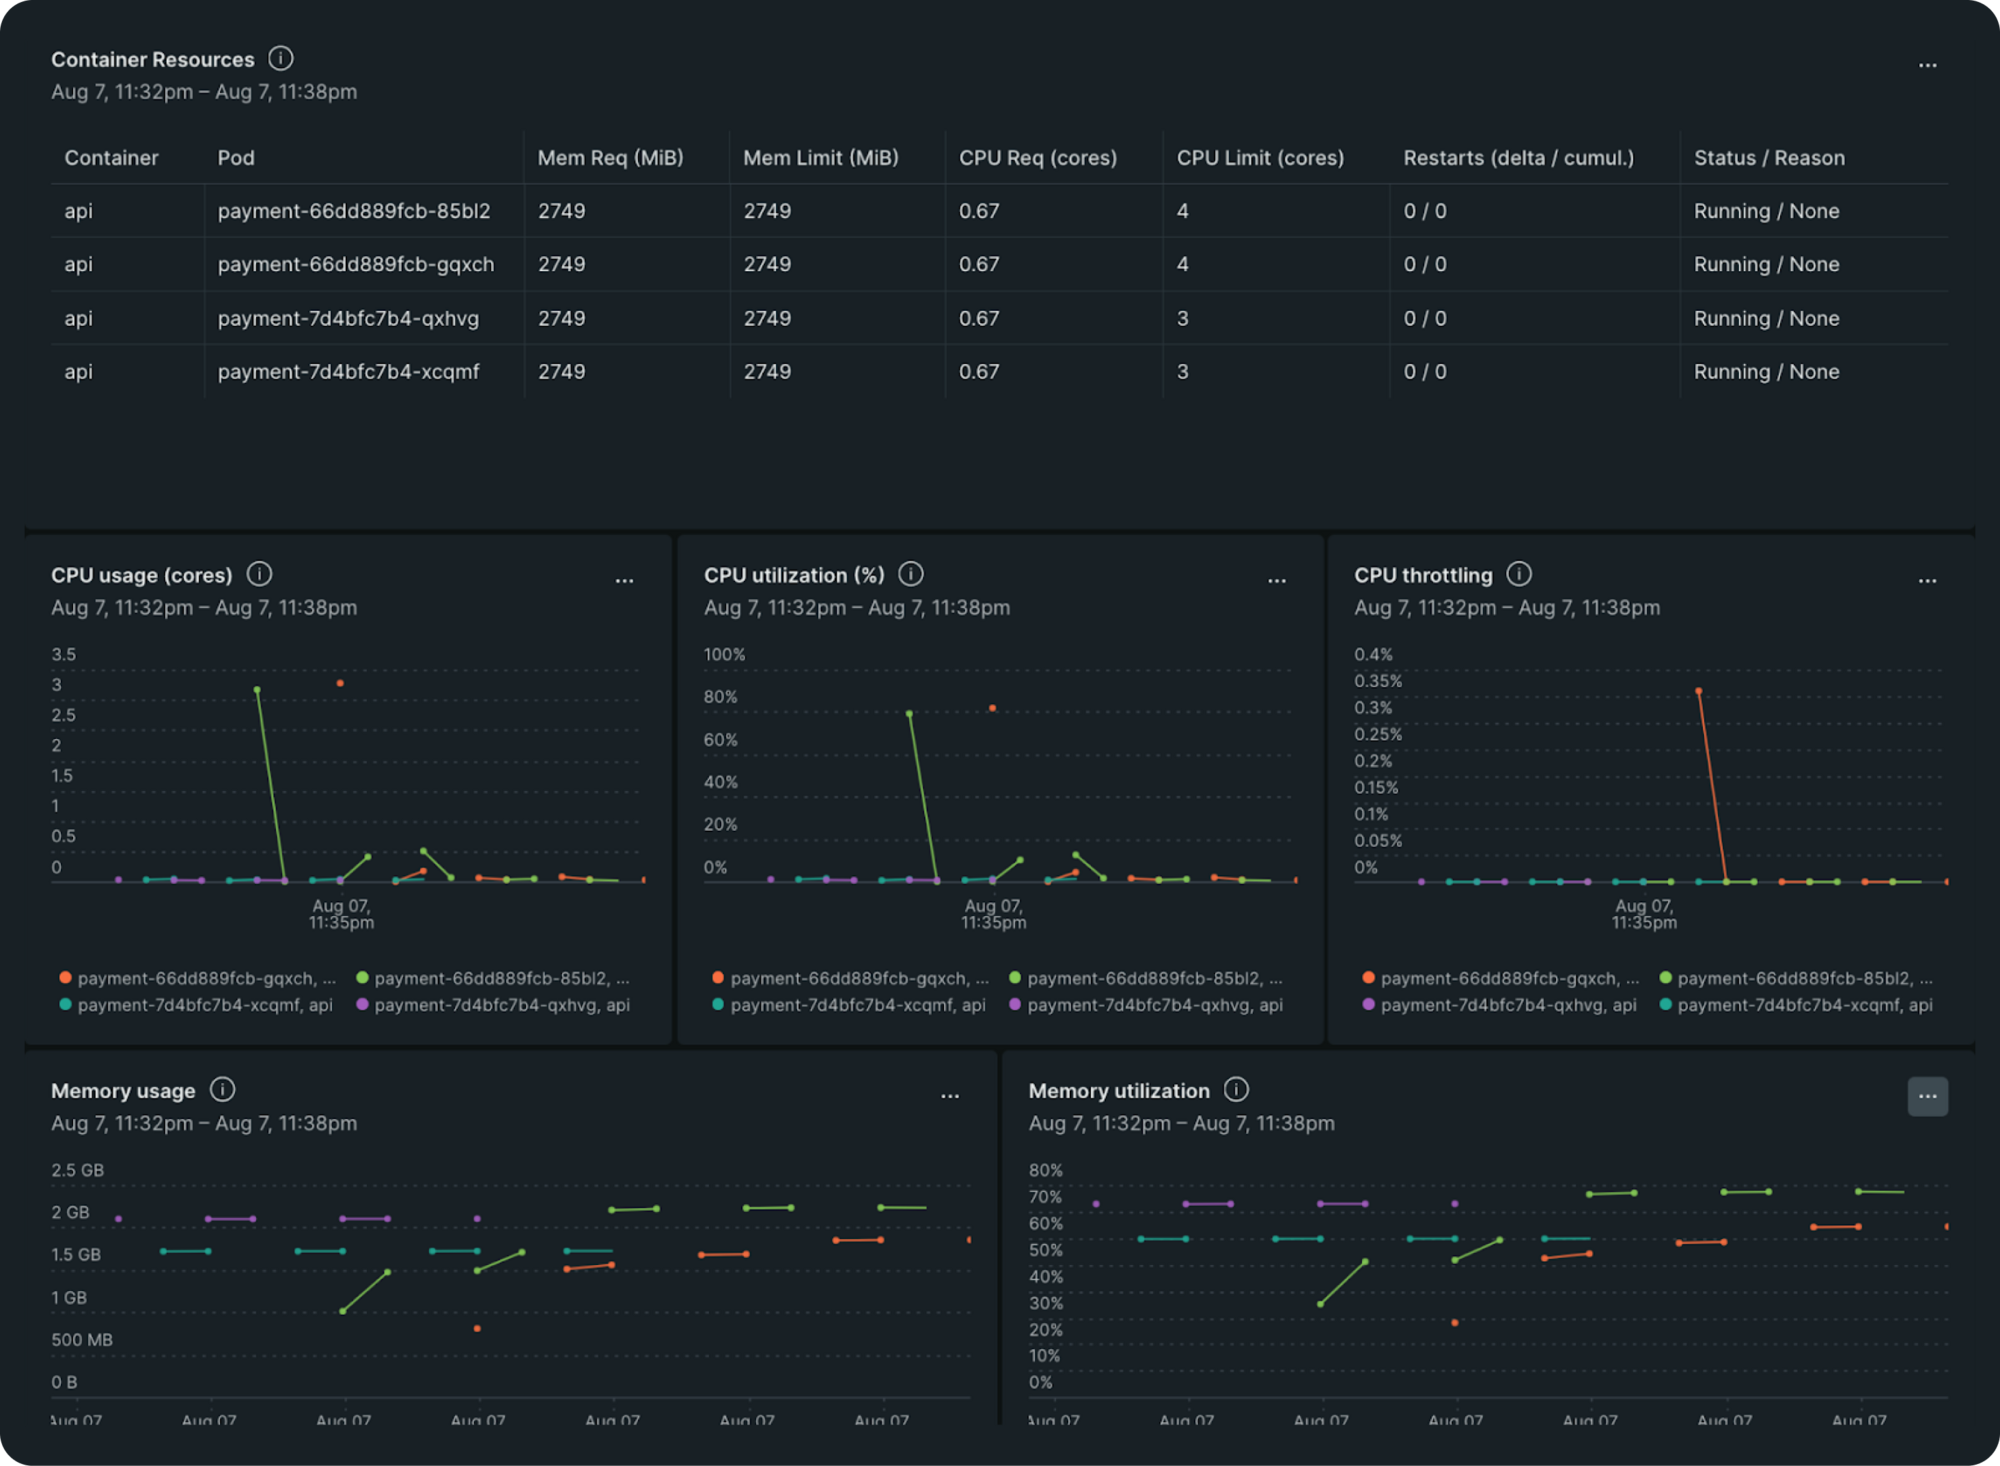
Armed with this understanding, we decided to test our hypothesis by increasing the CPU allocation to 4 for both request and limit. This decision was intended to provide our service with the necessary headroom to handle the demands of the startup process more effectively. We observed a significant reduction in throttling. The CPU utilization stabilized, and the latency for those critical initial API calls dropped dramatically to under 750 ms. Additionally, it helped us bring the time taken for the pod to become available to serve requests down from ~90s to ~30s.
A bit about JVM compilation
While we had developed a solution, we were still grappling with the core issue of long serving time. Our previous attempts, executing a SQL query during startup and increasing CPU allocation were indeed interconnected. As we dug deeper, we realized that the Java Virtual Machine (JVM) was taking an excessive amount of time during the execution of the initial API calls. This lag was a key contributor to the latency issues we faced.
The reason for executing SQL queries during startup helped us realize that these libraries were pre-loaded and compiled as part of the service initialization. This essentially meant that when the application began to serve requests, many of the necessary classes were already in memory, reducing the time spent loading them on the fly. Similarly, the increased CPU allocation allowed the JVM to load and compile libraries more quickly, which resulted in a significant drop in latency for those initial calls.
Understanding JVM compilation. Key takeaways:
- JIT compilation strategy: Starting with Java 8, most JVMs employ a Just-In-Time (JIT) compilation strategy. This approach compiles code during runtime rather than ahead of time, which can lead to improved performance as the application runs.
- Initializing challenges: While JIT compilation enhances performance during execution, it introduces starting up issues. This is because it compiles code just in time–resulting in delays during the initial execution. The reason: JVM spends time loading and compiling classes when they are first needed.
- Class loading dynamics: During the Java service bootstrap process, some classes are both loaded and JIT-compiled upfront, while others are compiled only after the service is marked as ready to handle requests resulting in the first few requests taking longer time to be served.
- CPU intensive process: JIT compilation is notably CPU-intensive and requires significant CPU cycles. The more complex the application, the more CPU resources will be necessary to compile and optimize the code effectively.
- Overall performance benefits: Despite the initializing challenges, JIT compilation is the preferred strategy for Java applications. It offers better overall optimized performance rather than peak performance, allowing applications to adapt and optimize dynamically during runtime.
Given these factors, we chose to stick with the JIT compilation approach. Altering this could have unintended consequences on garbage collection times and overall application stability. Our focus remained on optimizing the starting up/initializing process and resource allocation to leverage the strengths of JIT while mitigating its challenges.
Kubernetes Burstable QoS
During our search for alternative solutions to enhance our application performance, we stumbled upon an interesting feature within Kubernetes: the ability to configure Quality of Service (QoS) for pods. We were using the Guaranteed QoS class for our pod configurations, which allowed each pod to receive the resources it requests. However, we realized that by switching to the Burstable QoS class, we could unlock additional resource flexibility that might significantly benefit our setup.
The Burstable QoS allows for unutilized CPU allocations from other pods on the same node to be available when needed. For instance, if a pod isn’t fully utilizing its allocated CPU, then the underutilized capacity could be temporarily allocated to other pods requiring additional resources. This flexibility can be advantageous during peak startup periods or when handling bursts of traffic, where certain pods may need extra CPU cycles to process requests efficiently.
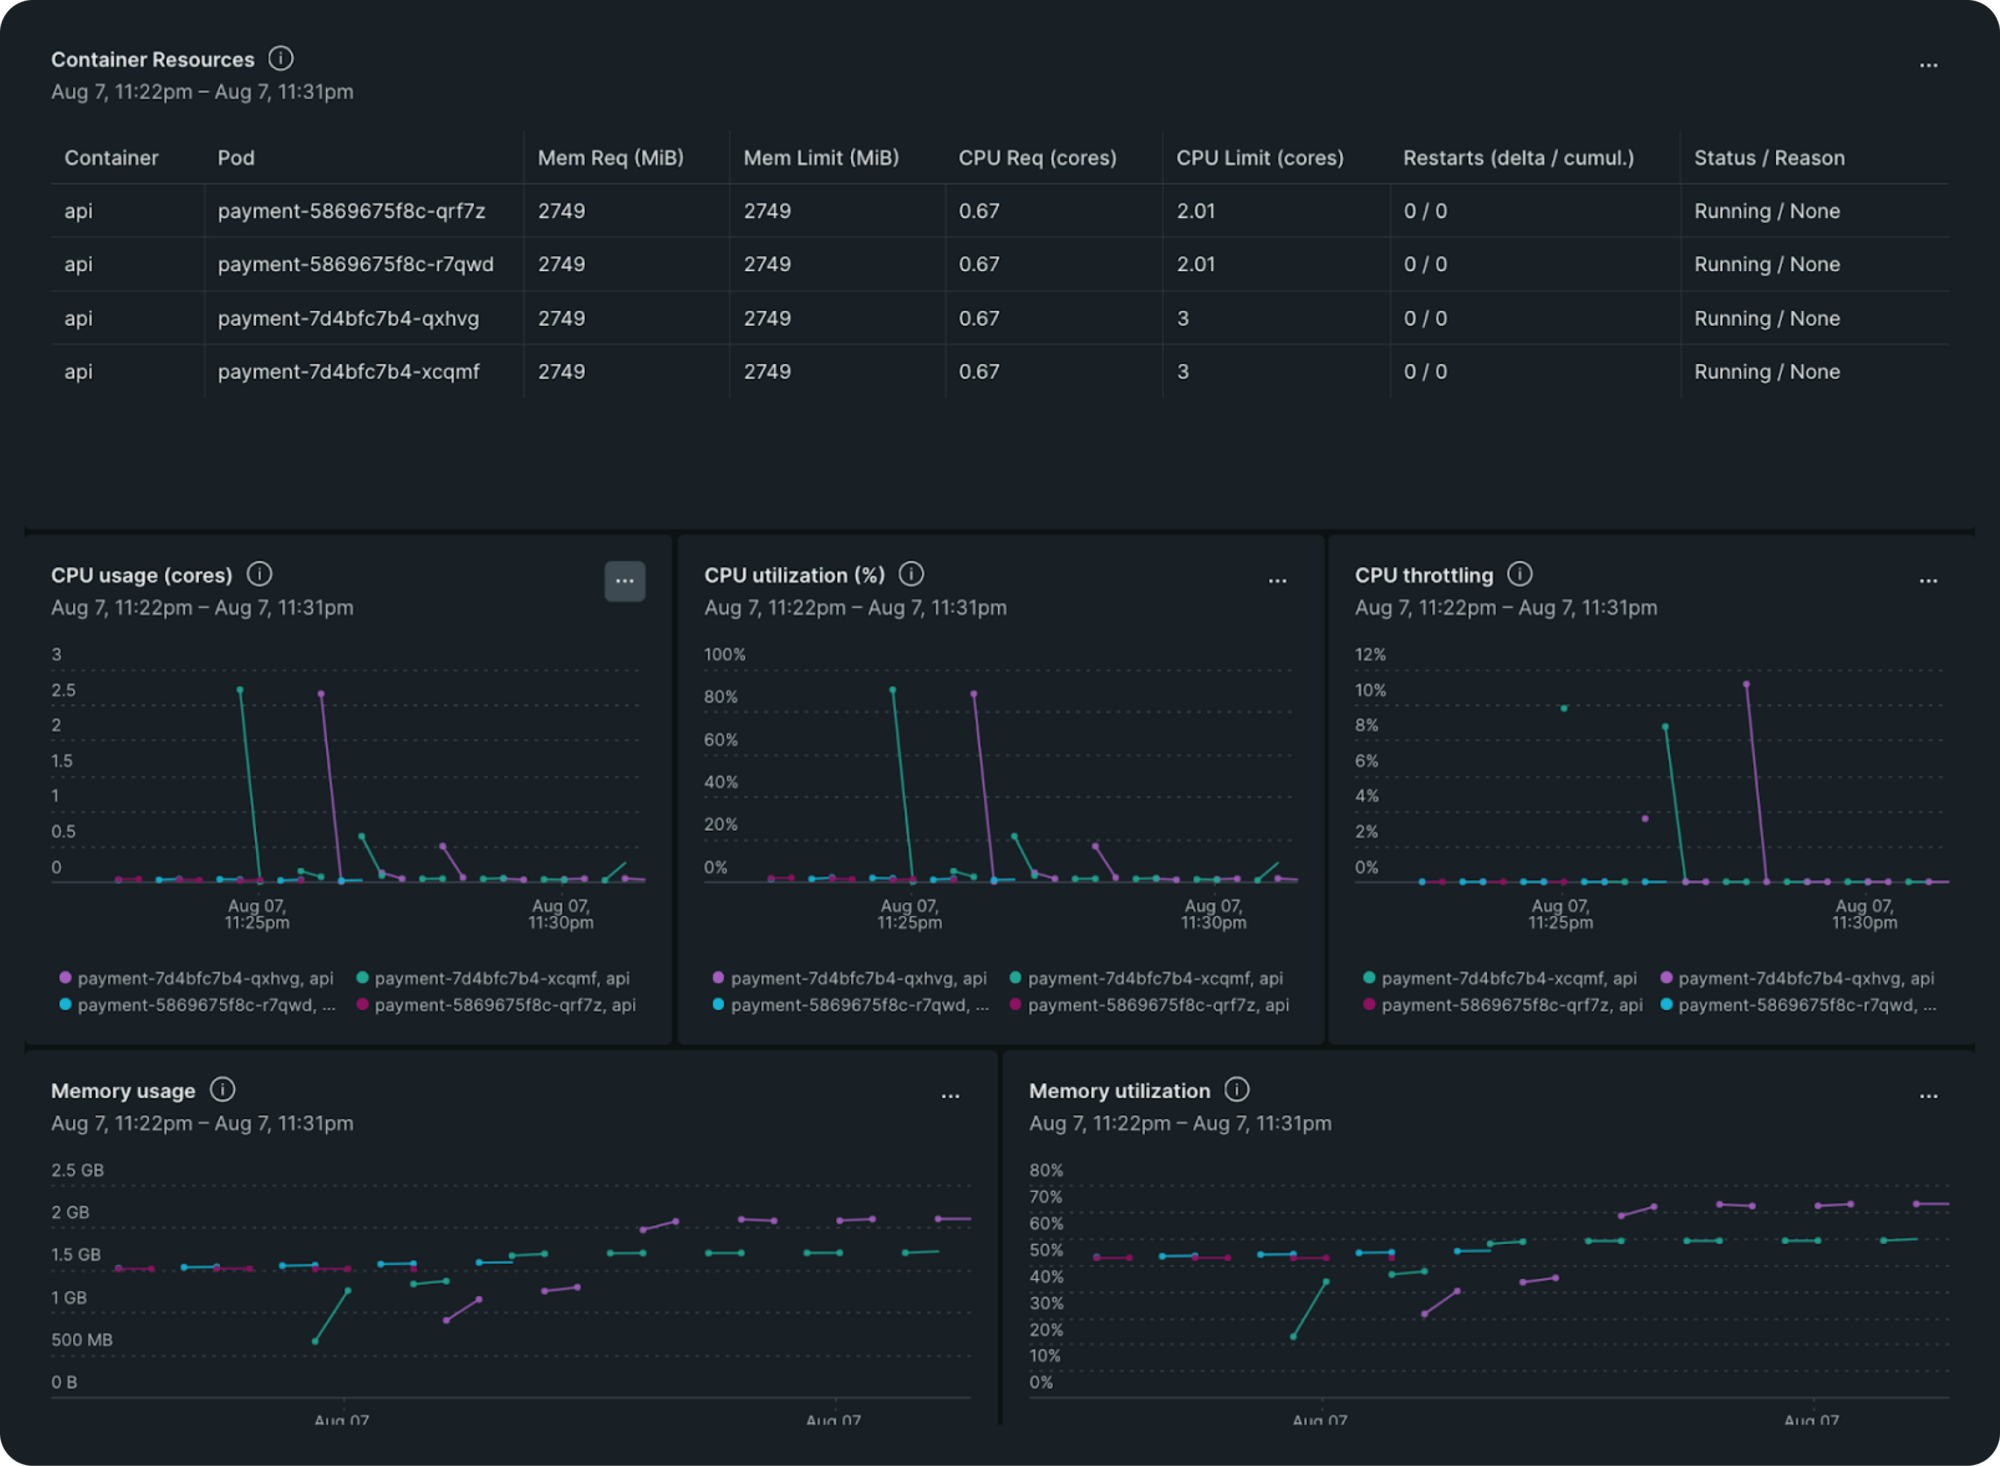
Our CPU utilization profile indicated that we had plenty of CPU resources that could be utilized more efficiently. By leveraging Burstable QoS, we could maximize resource usage without compromising on performance during critical startup times. So, we kept the CPU request value unchanged and changed the limit value to 2 after trying out different values from 2 to 4, CPU profile graphs for different values are shared below. This change allowed our pods to share resources more dynamically, optimizing CPU allocation based on real-time demand.
AWS burstable performance instances
We also had an additional layer of burstability at our disposal through the use of burstable AWS instances, specifically the t3a instance type. These instances operate on a baseline performance level of 40%, meaning that as long as our CPU usage stays within this threshold, we accumulate credits. These credits can then be utilized when our CPU demands exceed the baseline, allowing for greater performance during peak times.
What’s particularly advantageous is that we can also tap into surplus credits, if required. This allows us to utilize the extra CPU capacity beyond the baseline, without having to rely solely on earned credits. This surplus is chargeable at a fixed rate.
Increasing our CPU limits, which could be utilized during warm-up and load testing, could lead to additional costs due to the use of surplus credits. To mitigate any unexpected expenses, we can set up alerts to monitor the CPU credit balance, notifying us if it falls below a predetermined threshold.
With these necessary controls and alerts in place, we can extract additional performance from our burstable instance class when required, ensuring that we strike a balance between performance optimization and cost management during high-demand scenarios. This proactive approach allows us to maximize the efficiency of our infrastructure while keeping a close eye on expenses.
Final thoughts
Through a strategic combination of application optimizations and infrastructure enhancements, we successfully reduced the latency of our initial API calls from approximately 10 seconds to around 750 milliseconds with the added benefit of lowering our application start time from ~90s to ~30s. By implementing targeted changes such as bootstrapping database connections, executing simple queries during startup (although with the CPU limit increase this wasn’t really necessary), and leveraging Kubernetes’ Burstable QoS and AWS burstable instances, we addressed key bottlenecks that contributed to the slow response times.
This multifaceted approach not only improved performance and contributed to enhancing the overall user experience. The reduction in latency underscores the importance of both fine tuning application behavior and optimizing resource allocation, setting the stage for continued scalability and responsiveness as we adapt to evolving demands in our digital landscape.
More engineering blogs by Xflow:


